NAS100 article summary
- Higher-Timeframe Bias: NASDAQ technical analysis remains cautiously bullish, despite the ongoing third-quarter corrective phase.
- Monthly FVG Reaction: Price previously reacted strongly from the monthly Fair Value Gap (FVG), supporting the broader bullish structure.
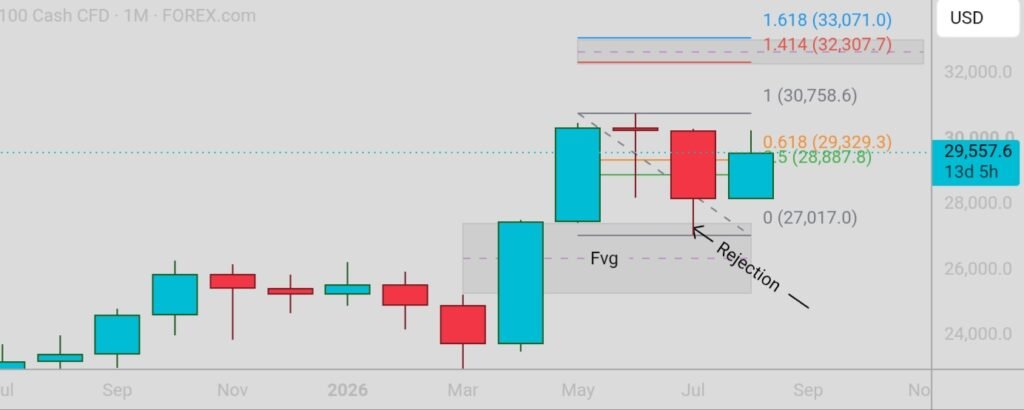
- Current Price: NASDAQ 100 is currently trading around 29,550, with the August monthly candle still developing.
- First Key Target: 30,700 is the primary resistance and first major upside target; a confirmed monthly close above it could strengthen the bullish continuation scenario.
- Second Target: A confirmed breakout above 30,700 could potentially lead toward 32,300, the highlighted Fibonacci Expansion level.
- Correction Risk: The current pullback may continue through September, so the monthly structure and FVG reaction remain important before expecting the next major bullish move.
NASDAQ 100 Quarterly Market Structure
Today, we will analyze the NASDAQ 100 from a higher-timeframe perspective and review its market structure since the beginning of 2026.
During the first quarter of 2026, the NASDAQ 100 experienced a significant pullback. After entering the second quarter, however, the market regained strong bullish momentum, as shown on the chart above.
As we moved into the third quarter, the price started another corrective phase. Since we are currently in August, the market remains within this third-quarter pullback. Based on the current structure, it is possible that this correction could continue through September before the market begins another bullish phase.
If the broader structure remains intact, the final quarter of the year—October, November, and December—could potentially bring renewed buying momentum and a bullish continuation.
Monthly FVG and Current Price Action
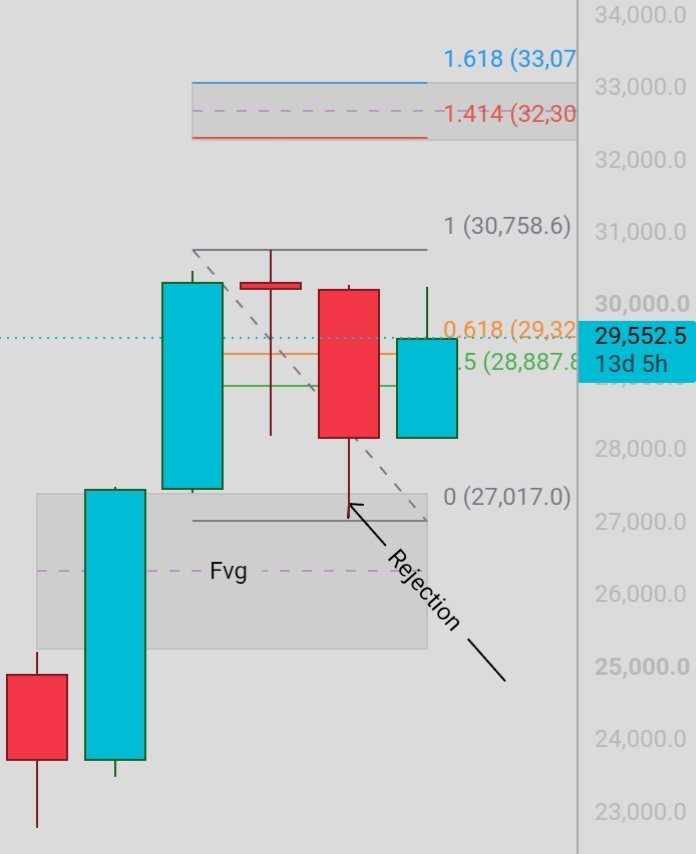
From a technical perspective, one of the most important areas on the chart is the Fair Value Gap (FVG). The price previously retraced into this FVG and produced a strong rejection from the zone. Following that rejection, the monthly candle closed higher, providing an additional indication of bullish interest.
The candle currently developing is the August monthly candle, and the NASDAQ 100 is currently trading around the 29,550 level.
At this stage, the price is approaching an important area, so the monthly candle close will be particularly important. A sustained bullish structure could provide the foundation for another upward move.
Key Targets and Bullish Scenario
If the current bullish continuation develops, the first major target to watch is around 30,700.
This level is important because it represents a significant resistance area. If the monthly candle successfully closes above 30,700, it could confirm further bullish strength and open the way toward the next major target.
The second target is around 32,300, which corresponds to the Fibonacci Expansion level highlighted on the NASDAQ 100 chart.
Therefore, the current higher-timeframe outlook remains cautiously bullish, with 30,700 acting as the first key level and 32,300 as the potential next target after a confirmed monthly breakout.
However, the market may continue its corrective phase before the next major bullish move begins. Traders and investors should therefore monitor the monthly structure, the FVG reaction, and the key resistance levels rather than assuming an immediate continuation.
As always, this analysis represents a technical market view and is not a guarantee of future price movement. Proper risk management should be considered before making any trading or investment decision.