EUR/USD Monthly Timeframe Market Structure
Today, we will do EUR/USD technical analysis tech based on the monthly timeframe. This is a potentially tradable setup, and the complete chart drawing is provided below so you can clearly understand the technical structure and key levels.
If we look carefully at the EUR/USD monthly chart, the price has been moving in a clear bearish structure, consistently forming lower lows and lower highs. This indicates that sellers have maintained control of the overall market structure.
Recently, the price broke below the previous support level. This move represents a Break of Structure (BOS) to the downside. After the structure break, instead of continuing immediately lower, the price moved upward and formed a pullback toward an important area of interest.
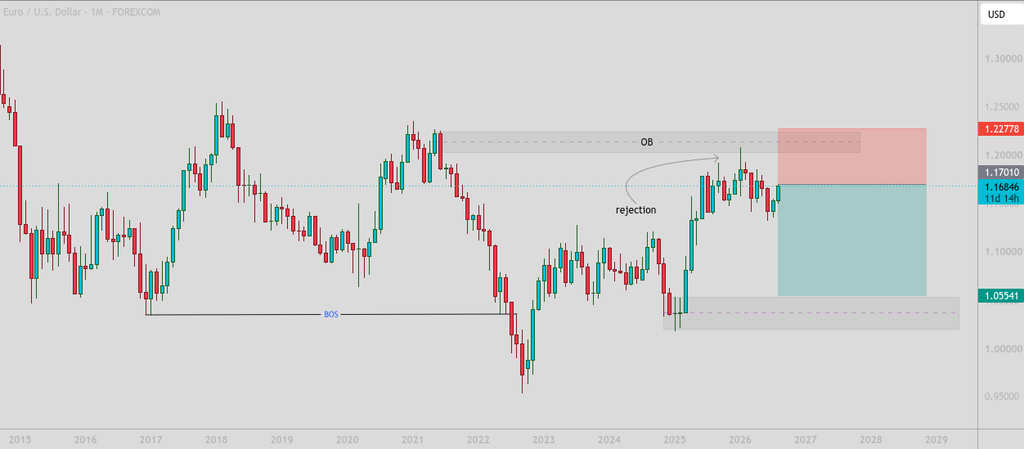
EURUSD Monthly Order Block and Bearish Rejection
During this pullback, the price reached our Order Block, which is located around the 1.2053 level. This area is important because it acted as the potential zone from which sellers could enter the market again.
As you can see on the chart, the price produced a strong rejection from this Order Block. This rejection provides additional confirmation that sellers are defending the area and that the broader bearish structure remains intact.
Following the rejection, the price moved downward again. The current price is around 1.1684, and based on the existing structure, we have also received entry confirmation for a potential bearish setup.
Entry, Stop-Loss and Target
Based on this technical structure, a potential sell entry can be considered around the current price area.
The planned stop-loss is near 1.2277, while the main target is at 1.0555.
The setup is based on the monthly bearish market structure, the previous Break of Structure, the retracement into the Order Block, and the strong rejection from that area. These factors collectively support the bearish scenario.
However, traders should always manage their risk carefully and determine their position size according to their individual risk tolerance. No technical setup can guarantee a specific market outcome.
Daily Timeframe Confirmation
Now, let’s move to the daily timeframe for additional technical context.
On the daily chart, EUR/USD has broken out of a double-bottom structure, which previously acted as a support area. After breaking above this structure, the price is now making another pullback.
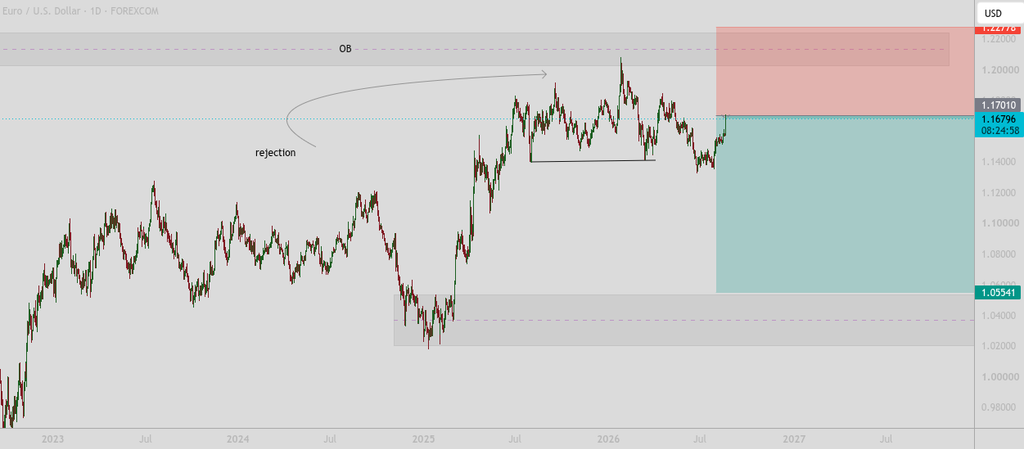
If this pullback develops as expected, there is a possibility that the price could move downward again. The daily timeframe has also developed its own market structure, providing additional technical information that can be used to identify potential selling opportunities.
Therefore, the monthly timeframe provides the broader bearish setup, while the daily timeframe can help traders monitor the price action and look for additional confirmation during the pullback.
Overall, the current EUR/USD structure remains bearish based on the analysis discussed above. The key levels to monitor are 1.2053 for the Order Block, 1.1684 as the current price area, 1.2277 for the stop-loss, and 1.0555 for the target.
As always, this is a technical market analysis and not a guarantee of future price movement. Trade at your own risk and always apply proper risk management.