Weekly Market Structure and Bullish Displacement
Today, I’m sharing my technical analysis and forecast for Gold (xauusd) on the weekly timeframe. This analysis focuses on the upcoming October–November period, so the levels discussed here should be viewed from a higher-timeframe perspective rathers than as a short-term trading setup.
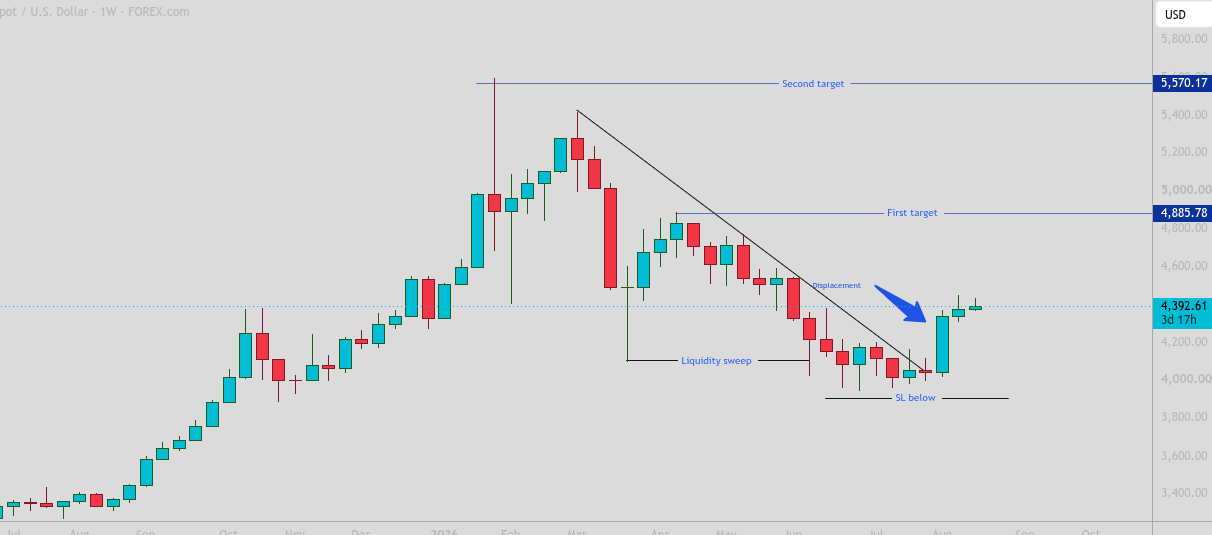
Looking at the xauusd weekly chart, we can see that Gold has recently swept liquidity before entering a consolidation phase. Following the liquidity sweep, the price remained within a range for approximately two to three weeks. After this consolidation, Gold produced a strong bullish weekly candle, which can be described as bullish displacement.
The current price is around 4,425. From the present structure, the first important upside target is around 4,800.50. The main reason for this bullish outlook is that I do not currently see a significant Point of Interest (POI) between the current price and this target that could create strong resistance or cause a major reversal.
Key Resistance Levels and Upside Targets
The next important level to monitor is the 4,850 resistance area. If Gold breaks this level with strong momentum and achieves a confirmed weekly close above it, the bullish structure could gain further strength.
In that scenario, the next major resistance and potential target would be around 5,100.
The weekly chart contains several technical factors supporting this outlook. We have seen liquidity sweeps, a trendline breakout, and a strong displacement candle. Together, these developments suggest that buyers are currently showing significant strength on the higher timeframe.
Of course, the market may still experience a temporary retracement before continuing higher. A pullback would not necessarily invalidate the bullish structure as long as the key support area remains intact.

Bullish Scenario and Invalidation Level
For now, my overall bias remains bullish. However, it is important to define the level that would invalidate this setup.If Gold closes below the key support area from which the trendline breakout and bullish displacement originated, the current bullish setup would no longer be valid. A confirmed breakdown below that area would indicate that the market structure needs to be reassessed.
At the moment, however, I do not see a clear technical signal suggesting that this bearish scenario is developing. Based on the current weekly structure, liquidity behavior, displacement, and breakout, Gold has the potential to continue its upward movement toward the 4,850. 4,850 and potentially 5,500 levels.As always, this analysis represents a technical market view and should not be considered a guarantee of future price movement. Proper risk management is essential for both traders and investors.